GiveMeApps Reviews
MV Charts V2 Android App Review
Jan 20th 2014 at 01:36am by GiveMeApps May Contain Affiliate Links (What’s This?)
There are tons of Finance apps on the Android platform that allow for analysis of stocks, trends and the market overall. None of these apps have access to the patent protected proprietary technology that MarketVolume prides itself upon. Touting themselves as the only source of the intraday volume charts for major indexes and exchanges, MV2Charts provides users with up-to-the-minute information and covers all aspects of technical analysis including price analysis, volume analysis, and analysis of advancing and declining issues and volume.
Enter MV Charts 2
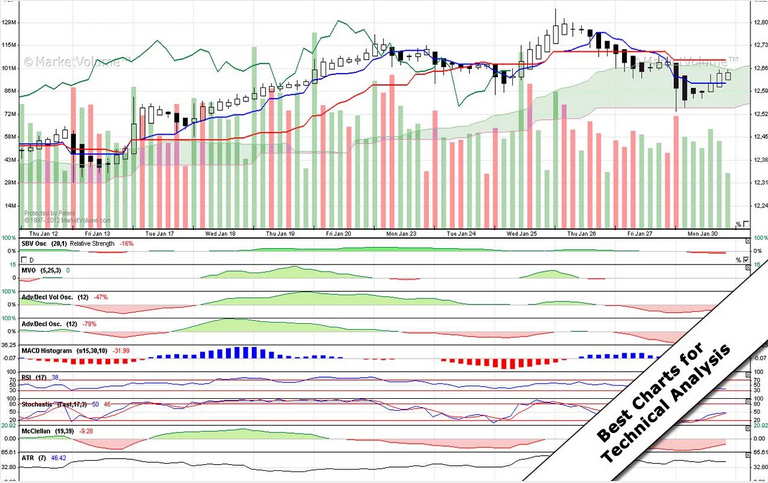
MV Charts 2 is a complex app as it should be. It displays a ton of information on the main screen. Firing up the app brings you the main area and displays three charts. The first is whichever index you choose to view. Choices include Dow Jones, S&P 500, NYSE Composite, Russell 2000, Emini Indexes and SHLD. The remaining charts include SBV Flow and AWS. Values are shown using line and bar graphs and the period displayed is changeable.
Tapping on the top left corner of the screen toggles the Legend which shows values for Date/Time, Open, High, Low, Close, Volume, SBV Flow and AWS depending on where the cursor is on the display. Tapping the top right corner toggles controls for Zoom In/Out for precision with regards to time periods. Up and down keys toggle between one and ten day bars.
The Menu
The majority of MV Chart 2’s functions lie in the menu key of your device. Here you can access Menus for Styles, Index, Performance Index, Types of Bars among others. Tapping on Style allows you to change the look and feel of the displayed data as well as the data displayed itself. The default is white. Black Zig-Zag is much easier on the eyes. MVO swaps out the SVB Flow and AWS charts for an MVO chart. SARCD displays SBV-Osc, MACD and V-MACD data using line graph and numerical values in percentages and changes. Volume Actuated displays VO, PVO, Chaikin and Volume ROC data.
View Period lets you set ranges of 2 hrs (with 1 minute bar) up to 1.5 years (with 1 bars). Types of bars lets you choose different ways to represent data from Dots and Candlesticks, to Lines.
Let’s Study
The studies menu brings up the plethora of studies we mentioned in the beginning of this review in a prompt. Choose from Volume MA (Simple) (200) to Adv/Decl Vol Osc (Advance Decline Volume Oscillator). From there you can set the Bar Period. At the top of the prompt, you have the following icons - Upper, Lower, Price, Volume and MV Advance & Decline Indicators (V-MA), all of which bring up Sub-Menus. Calling up the PRICE sub-menu for example requests that you choose from several dozen studies ranging from Up/Down Price and V-MA (Volalility Adjusted Moving Average) to Aroon (Aroon Indicator) to Pivot Point. Selecting any of the studies lets you set the bar period.
Add Stock, another menu item, not surprisingly lets you add a stock to track. We typed in IBM and stock information showed up instantly.
Verdict
Considering we are not finance gurus, the app seemed a bit overwhelming, but we know that in the right hands, this would be an invaluable tool. It is amazing the amount of information that Market Volume managed to squeeze into this free app. Though we covered quite a bit in this review, in fairness, several pages in a magazine still could not do this app justice. You owe it to yourself to visit MarketVolume.com, as well as the app listing to truly get an idea of the scope of what this app has to offer.
GMA


 Download iOS, Android & Windows apps!


